Exploring data with New Relic logs
A new way to filter, explore, and troubleshoot using log data.

PROBLEM
How do I understand my logging data?
New Relic One is the leading observability platform where Dev and Ops teams come together to solve problems with data. Customers send us data and we help them monitor, debug, and improve their entire development stack.
A log is one of the oldest computer-generated data points that contains information about usage patterns, activities, and operations within an operating system, application, server or another device.
During our testing of the redesign in the previous case study we observed that customers were having a difficult time using the attribute section in the sidebar. While this was a usability problem, we also observed that different users mental models used the product to troubleshoot differently.
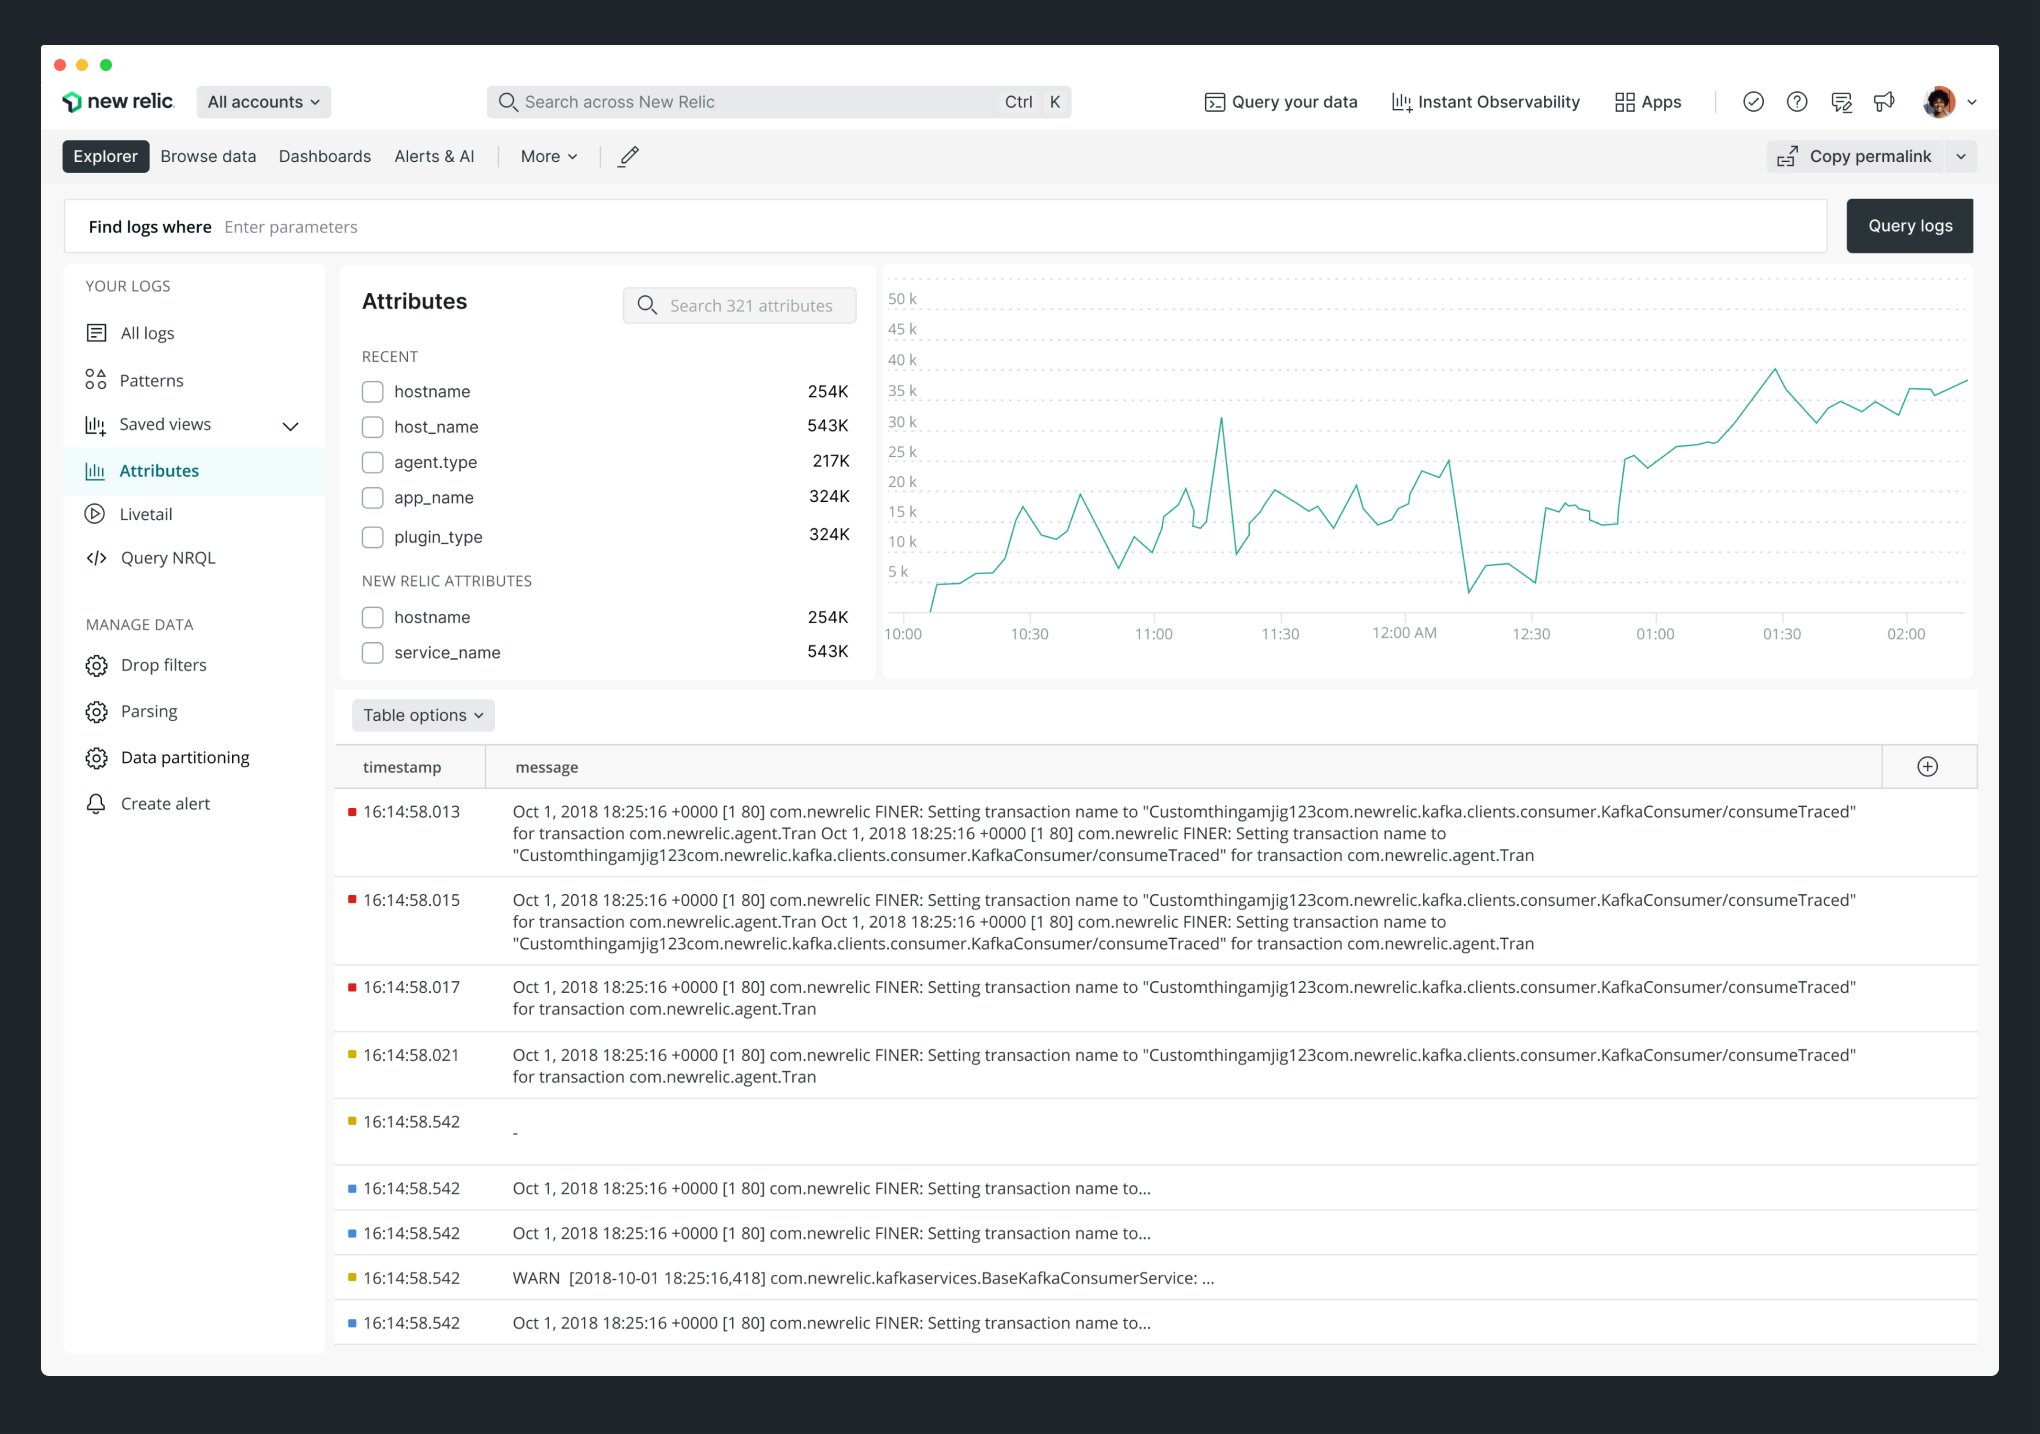
The overall problem is people were having a hard time understanding the log data available to them. Log data is messy and the data is formatted differently between different applications, hosts, services, and more.
They used different areas of the interface to try to understand the data.
We think this is because different users have different maturity in the SDLC and observability.
RESEARCH
Unmoderated testing of the current design
I tested our current design to understand further what exactly was happening and to further understand our customers mental models. I tested with close to 12 different customers and captured the information to find similarities and differences between new customers and users who have never used New Relic before. What is interesting about this study is about half of the participants used the query/search bar to find logs and the other half used the attributes to filter to find logs.

DESIGN
Goals of the attribute redesign
Based off the research we identified different goals we wanted to accomplish with the attribute redesign. I worked with PMs and other stakeholders to present the research and align on goals.
Allow customers to easily filter log data and be transparent about the logs they are currently viewing. The old design was confusing on what attributes a user selected.
When selecting attributes we should build a query at the same time to educate customers and give feedback on how they might query the data in the future. The theory is we would be creating power users of New Relic Logs.
Show a time series chart that is updated based on attribute selection.


OUTCOMES
What was the impact and how did we measure
We saw a significant increase in our customers using attributes with the new design. More customers were not only discovering more attributes but were using the new filter design to troubleshoot and find the logs they were looking for.
The increase of engagement was almost 300%.
We have plans to release a version two next quarter based on additional feedback and research.